The year is coming to an end, so it is naturally time to look back and think about what we did well and where we still have significant work to do. Besides business results, one of the most important ways of collecting feedback for us at Degordian is a yearly Deep-dive survey by Luppa. We also collect and keep track of this feedback every month, using Pulse (Luppa’s monthly short survey), so we can see and react if some weak points emerge on a regular basis. Deep dive is a longer version of the questionnaire, going, as the name suggests, much deeper and providing us with invaluable feedback from our employees.
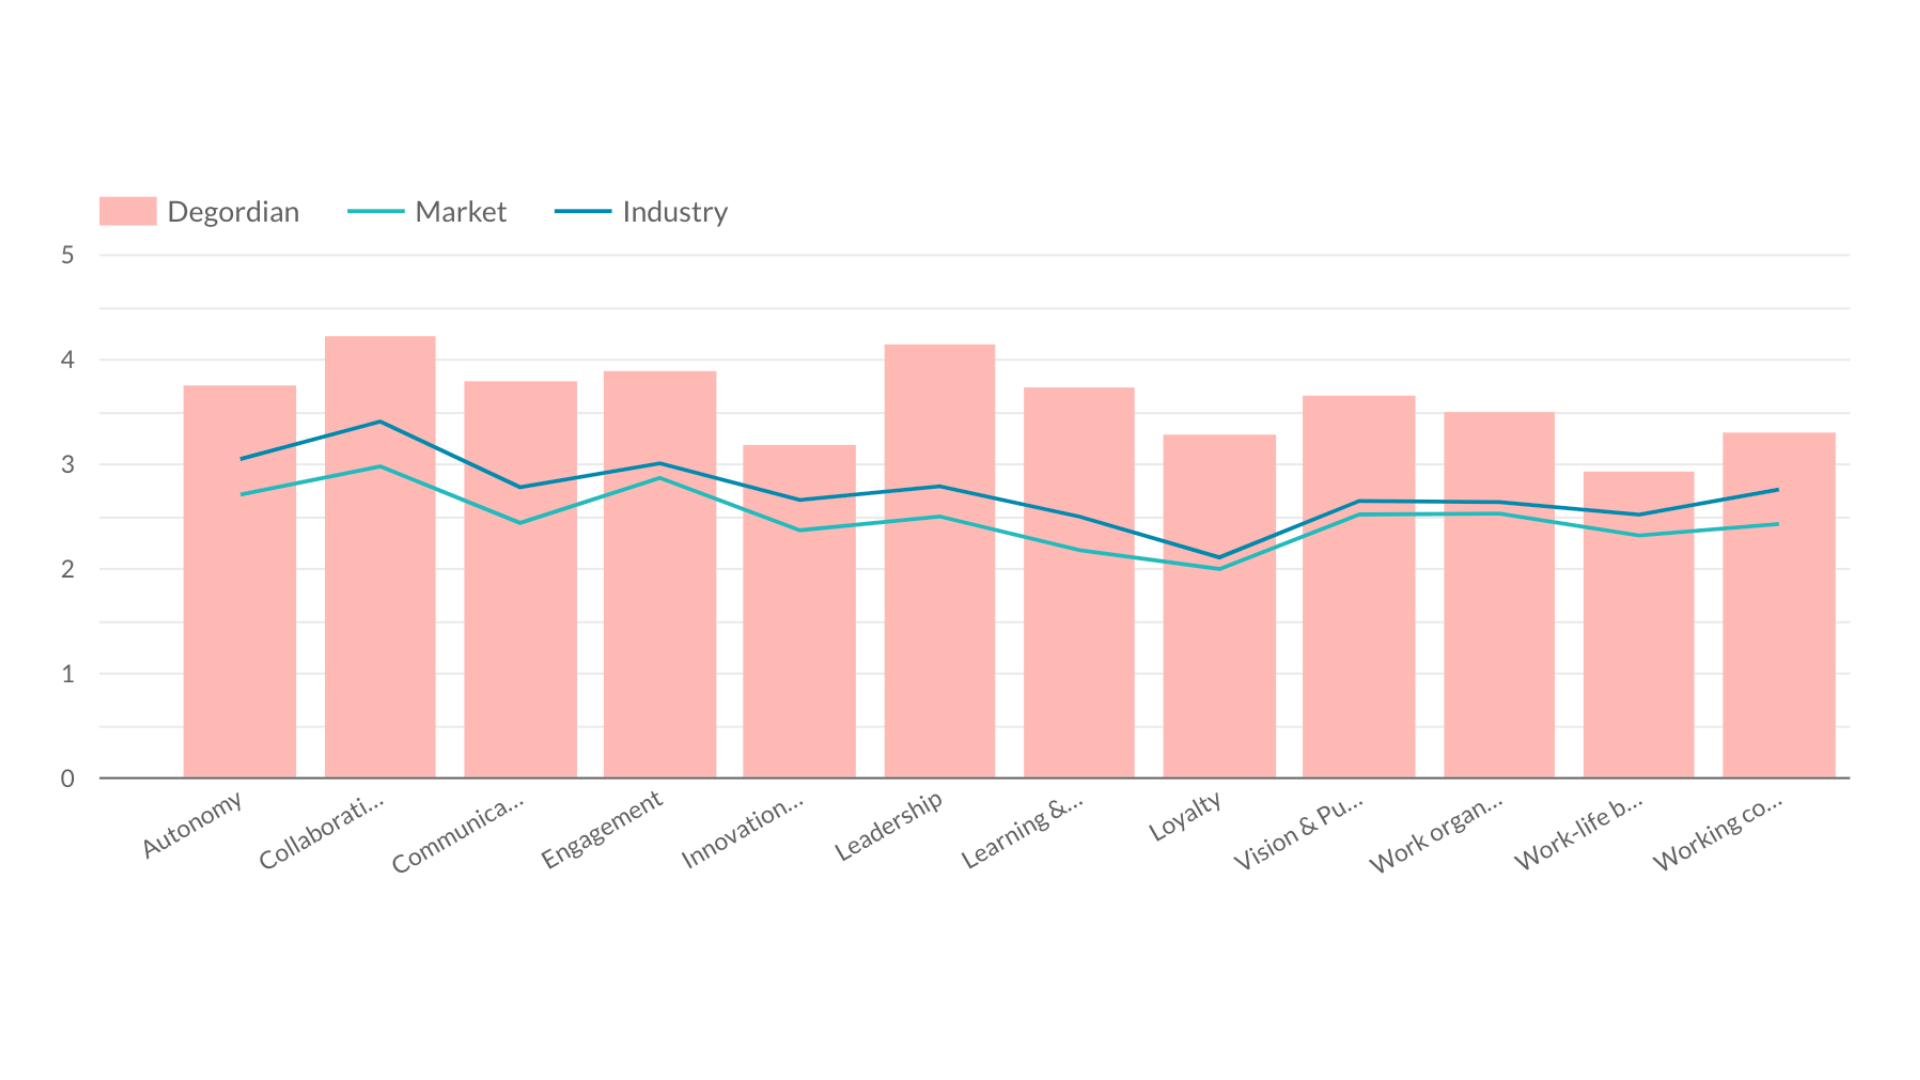
In other words, one of the most important things for us is to listen to what our employees have to say to analyze their satisfaction and engagement. And, to dive straight in – they said that they are more satisfied and engaged than last year! We pride ourselves on being transparent, so let us check out this year’s results in more detail. But before that, we suggest you look at last year’s results to compare them.
Ready?
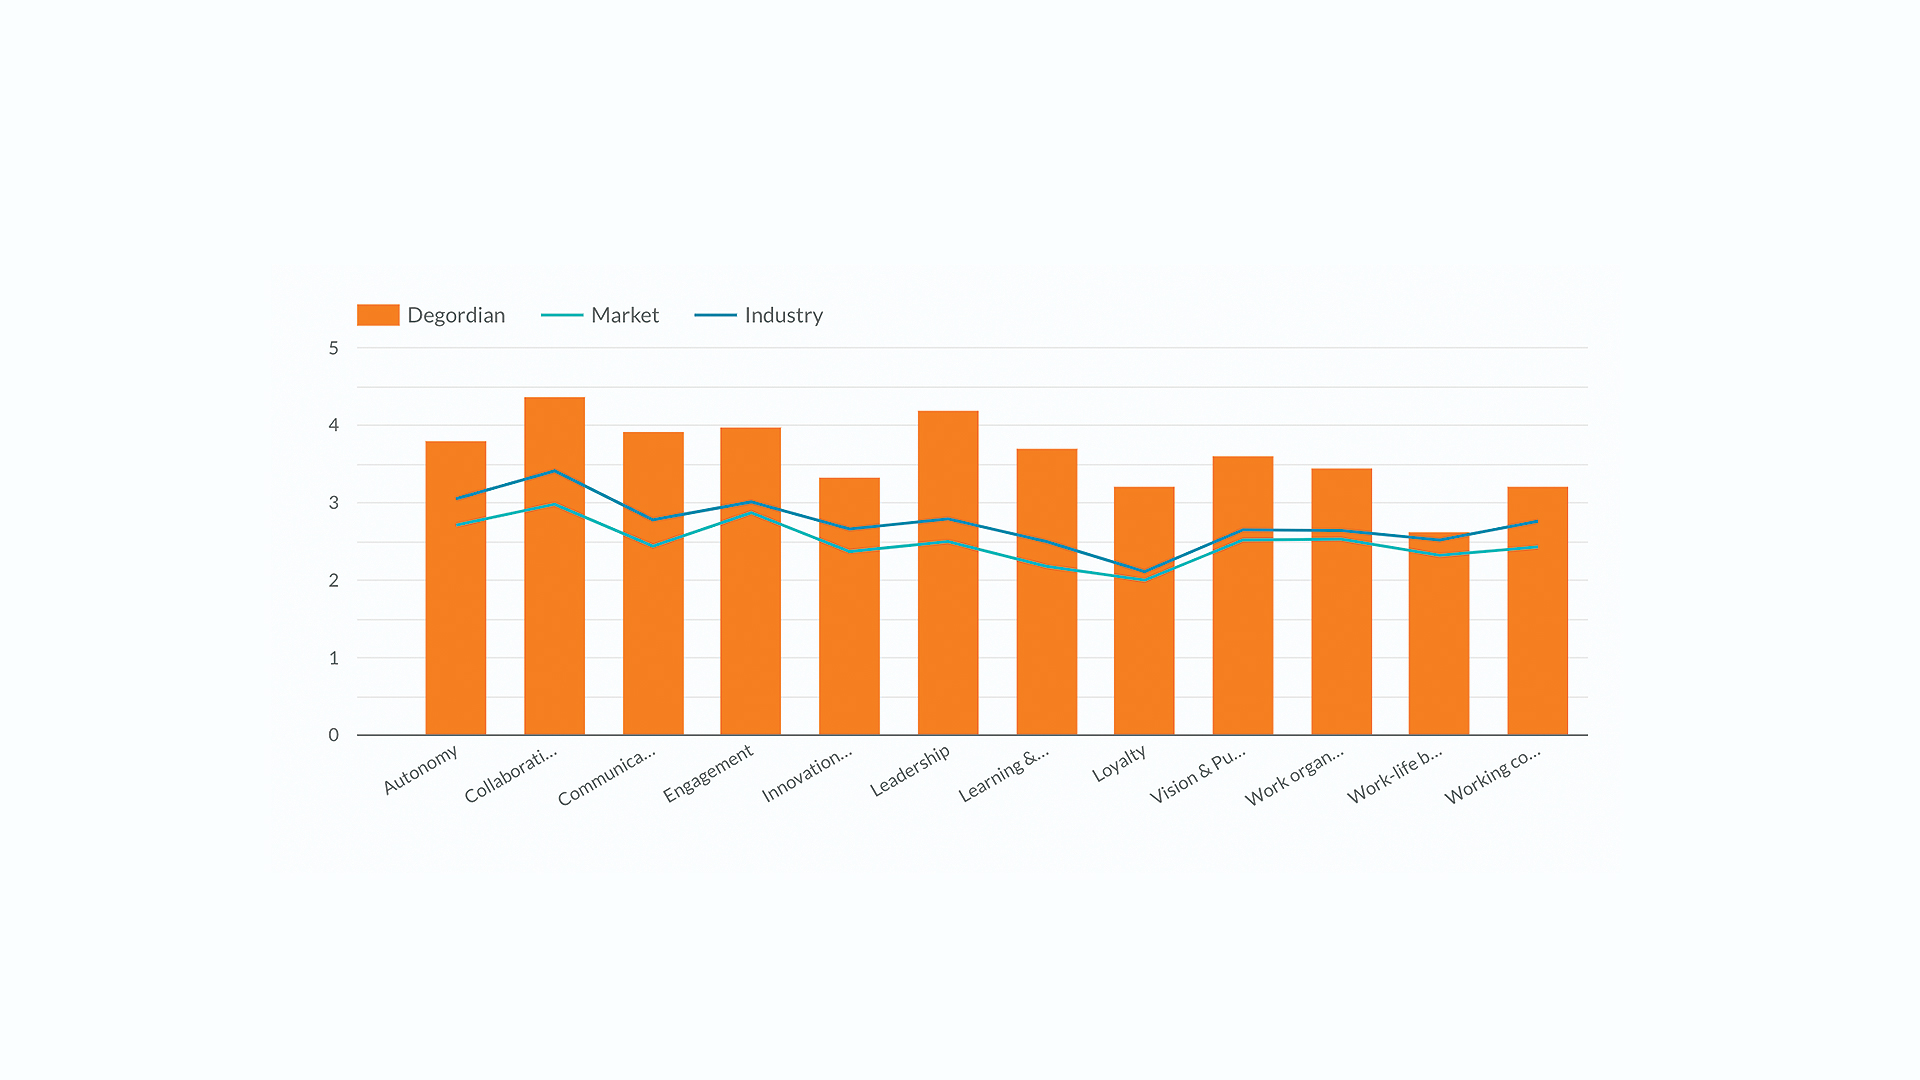
Ta-da! Here are our results for 2023 (with industry and market comparisons)!
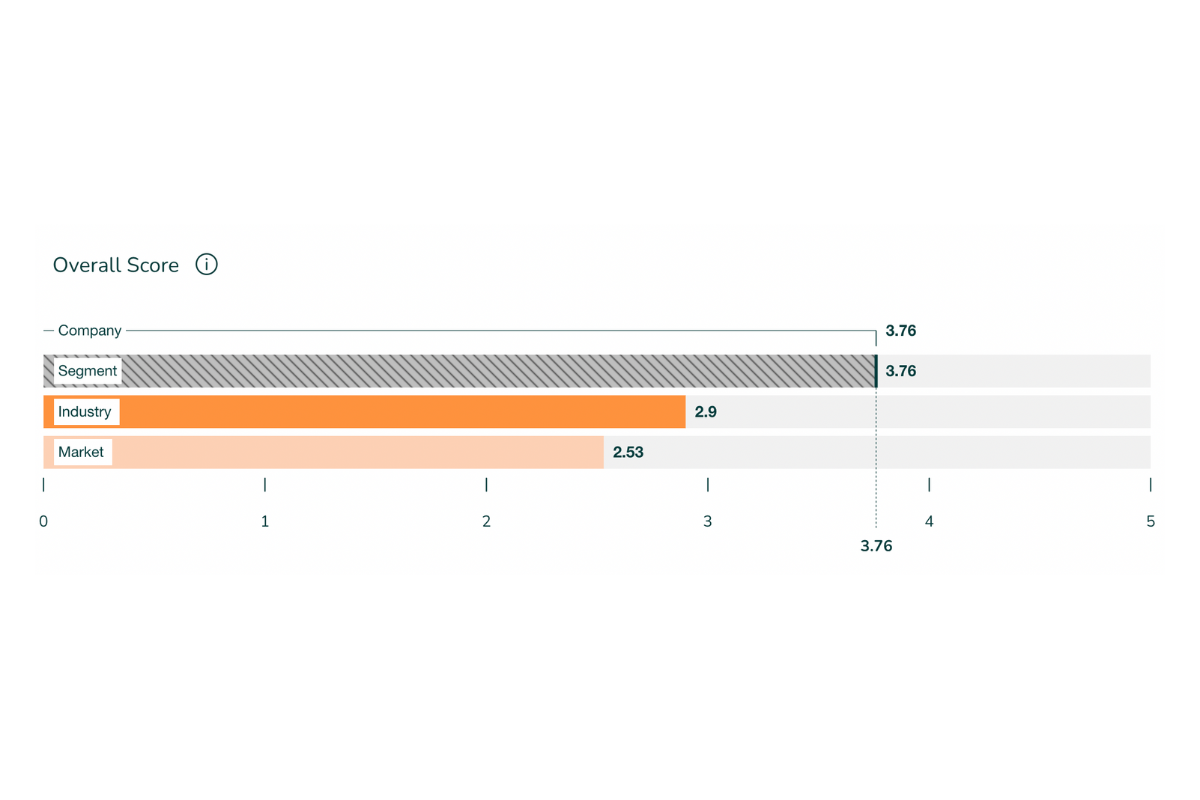
We surpassed our last year’s overall result and achieved significantly higher results than industry and market. Now, let us see our results across different dimensions.
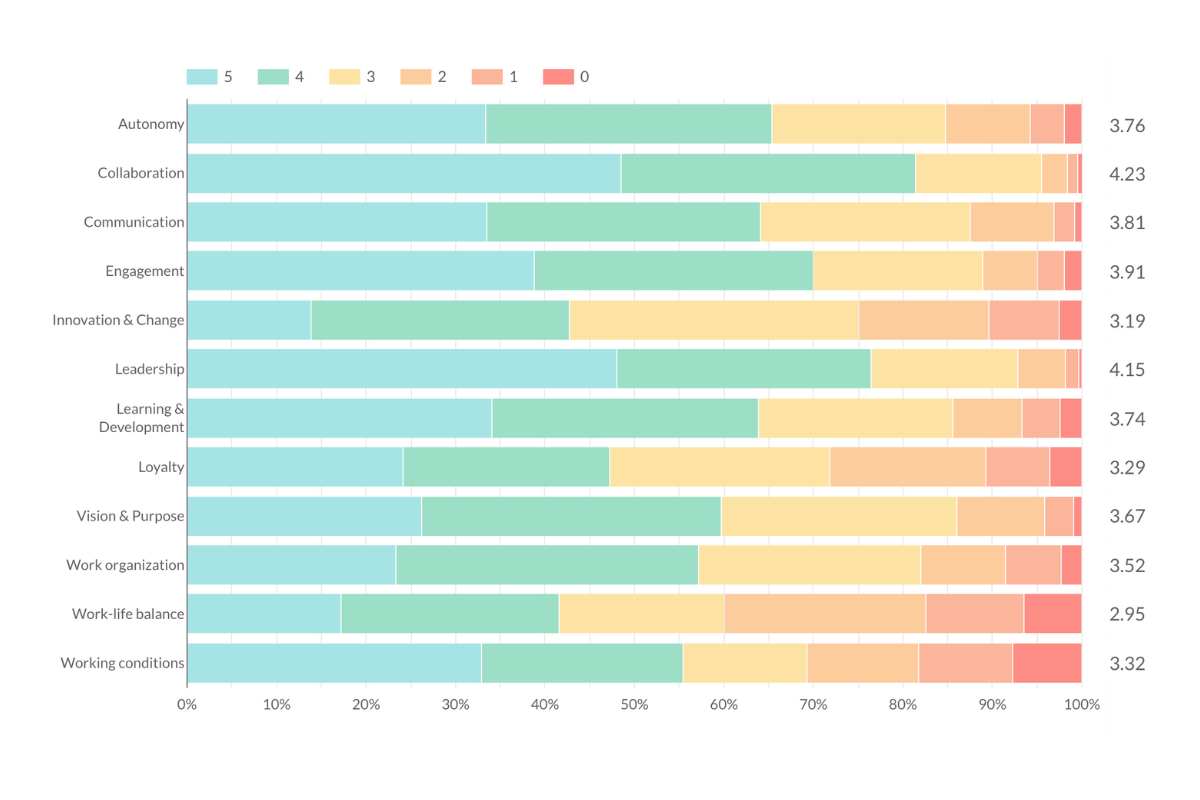
Of course, some dimensions show a slight decline, while the results on others are higher compared to last year. In this blog, we will not go into a detailed overview of dimensions merely because of the complexity of every dimension.
To keep it short, last year, our best-graded dimensions were Collaboration (4.29) and Leadership (4.08). These categories are also the best-graded ones in 2023. Collaboration is still the dimension with the highest grade (4.23), while the Leadership dimension got a higher score (4.15) when compared to last year.
After the good news, let us see the bad ones. Just kidding – we see every negative feedback or lower grade as an opportunity for growth! Last year, our employees gave the lowest grades for Work-life balance (2.55) and Loyalty (3.10). This year, Work-life balance has significantly grown and has gotten 2.95, while the second category with the lower result is Innovation and change (3.19). Additionally, our loyalty score improved to 3.29. The results of the engagement part of the survey show an increase of engaged employees, and decrease of the ones that are demotivated, in comparison to last year.
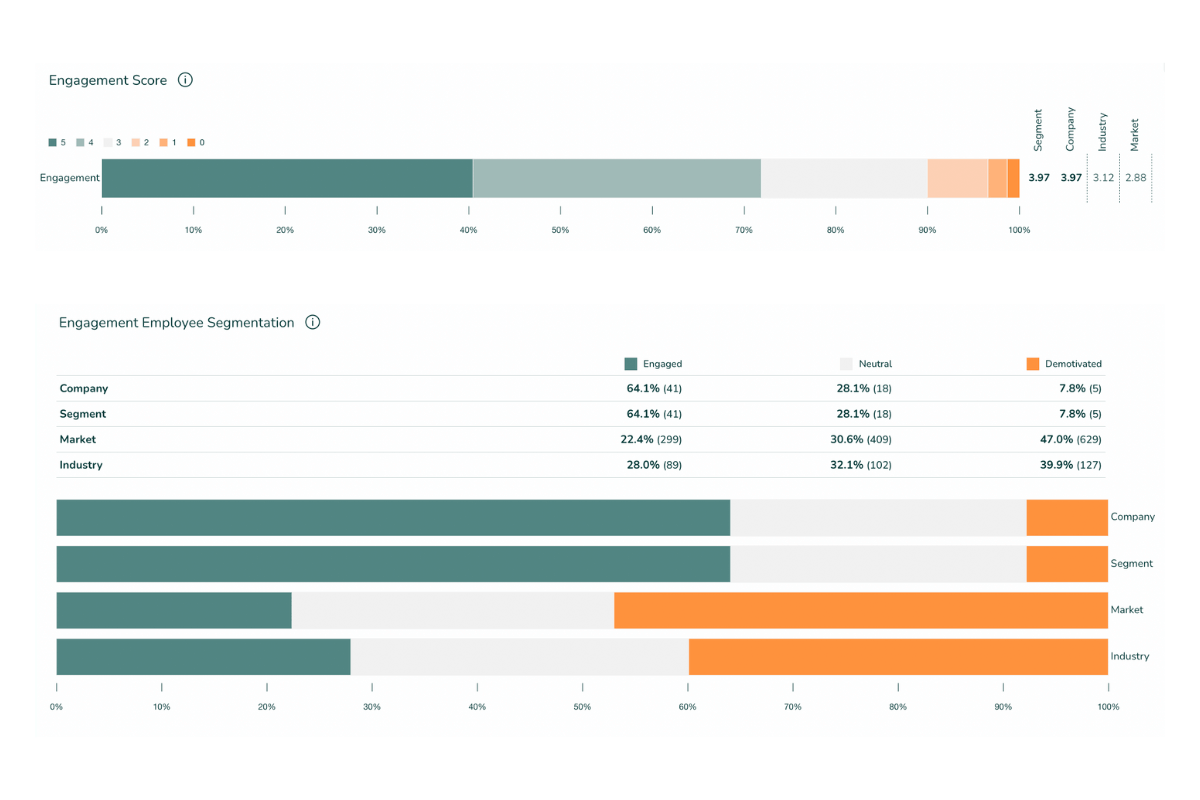
As said before, we are very satisfied with this year’s results and with the fact that our employees are more satisfied and engaged than before! Results of these improvements are already showing, as we managed to boost applicant numbers by 65%.
Our next steps? Filter and check out the results for every business unit and company as a whole, then organize workshops with employees and managers to further address our weak points and create action plans to further improve employee satisfaction and engagement – because despite above-average results compared to both industry and market, we are strong believers that we can always do more for our employees. In addition, we will continue tracking the pulse of Degordian throughout the year using Pulse by Luppa to keep an eye on any changes. This will help us notice any decreasing trends and react on time, as well as pinpoint any activities that give us desired results so that we can keep doing what we are doing well and ultimately, hopefully, turn our weaknesses into strengths!
Before you leave, make sure to read this!
- What you just saw are a few of the most important results. Yearly surveys using our Luppa tool can generate much more detailed results and provide deep analysis presented in the form of numerous graphs.
- Although Luppa allows advanced filtering, the data shown is on the overall company level.

