
The days of relying on hunches and guesswork are long gone. In the digital world, metrics are important more than ever. Whether you are a business owner, a marketing enthusiast, or simply someone with a curious mind, we invite you to explore the world of digital marketing metrics.
In this blog we’re helping you understand what various digital marketing metrics mean and how to use them to your advantage.
What are digital marketing metrics?
Digital marketing metrics are values that support marketers in tracking, measuring, and recording their marketing efforts. There are many digital marketing metrics and they often differ from various digital marketing analytics platforms, but essentially, they are insights into different aspects of the business’s performance.
But do not be mistaken, metrics are not the same as KPIs, even though they both are indicators of a business’s performance. As CXL Institute described it: “KPI is a quantifiable measure of business goals, while a metric measures progress toward a goal at a tactical level.”
Digital marketing metrics you need to know
Website marketing metrics
Website marketing metrics are metrics directly related to your website performance and are provided by web analytics tools like Google Analytics 4. For this purpose, metrics from the new generation of Google Analytics (GA4) are described below.
Page views
Page views represent the number of times a page on your website was viewed. When a user views your page on the website it is counted as one view, but if he loads it again it is counted as two views.
Users
Users are simply visitors to your website. The user metric is differentiated into four categories:
- Total users
- Active users
- New users
- Returning users
Total users represent the total number of visitors to your website, while active users represent engaged visitors of some sort or who visited your website for the first time.
Returning users represent the number of visitors that are returning to your website, while new users represent the number of visitors who interacted with your site for the first time.
Engagement rate and bounce rate
Many mistake bounce rate for instances where users land on a page and quickly exit, but that is not the case. Bounce rate (until now) indicated the percentage of total users who visited a site but left without performing an action, such as clicking on a button or opening a new page.
And the old way of measuring bounce rate is slowly going away with the new generation of Google Analytics (GA4) after the introduction of the engagement rate metric. So, let us explain the engagement rate since bounce rate is now the opposite of it.
Engagement rate is the percentage of engaged sessions on your website ─ a session lasted longer than 10 seconds, and the user completed a conversion event or viewed at least 2 pages.
Conversion rate
There are two types of conversion rate metrics in GA4:
- User conversion rate
- Session conversion rate
User conversion rate represents the percentage of users who converted (triggered a conversion event), while the session conversion rate represents the percentage of sessions in which a conversion event was triggered.
The conversion rate metric is undoubtedly one of the most important metrics for businesses to track. It is essentially the percentage of completion of a business’s most desired actions (or steps that lead to the most desired actions), such as completing a form or making a purchase. If you do not know if your efforts are leading to the most desired actions, you are essentially shooting your shots blindfolded.
Email marketing metrics
E-mail marketing is powerful, but to maximize its effectiveness, it is essential to track some key e-mail marketing metrics which will provide valuable insights into the performance of your e-mail campaigns and strategy.
Open rate
The open rate represents the percentage of e-mail recipients (subscribers) who opened your e-mail. By tracking this metric you can, for example, see what messaging in subject lines works or does not because it is the first thing subscribers see, and from which decide whether they will open the e-mail or not.
With valuable insights from the open rate metric, marketers can determine what type of messaging is likely to result in higher engagement rates, but also the appropriate content that is relevant for their subscribers.
Click-through rate (CTR)
Click-through rate (CTR) in e-mail marketing represents the percentage of clicks on the links you provided in your e-mail.
Let’s say you are having a special offer for your e-mail subscribers ─ the percentage of clicks on a link in your e-mail that leads to the special offer would be considered a click-through rate. By analyzing the CTR you can assess the efficacy of different placements and messaging of the call to action (CTA) button when optimizing your e-mail marketing campaigns.
Unsubscribe rate
Unsubscribe rate is a metric that represents the percentage of total e-mail subscribers who unsubscribed upon receiving your e-mail. Mailchimp did a study among their customers from different industries which has shown that the industry average unsubscribe rate is at 0,26%.
Extremely high unsubscribe rates may lead to internet service providers blocking your e-mails from reaching your subscribers’ inboxes. But this metric is not always a messenger of bad news (even though it is not the most pleasant thing to see in higher numbers) ─ a higher unsubscribe rate can mean you are refining the subscriber list, ensuring it remains tailored to the right audience.
A lower unsubscribe rate is not always a good thing either ─ many subscribers will not go to the lengths of clicking “unsubscribe”, because they will most likely just ignore your e-mails. That is why it is important to track it along with other e-mail marketing metrics, such as the number of engaged subscribers.
Conversion rate
In e-mail marketing, conversion rate is nothing more than the percentage of people who received your email, clicked a link in it, and completed a specific desired action.
Once someone clicks on a link in your email, the main objective is to get them to convert, persuading them to perform the desired action. That is why this metric is among the most important e-mail marketing metrics to track.
Forwarding rate
Forwarding rate represents the percentage of subscribers who shared your content with others (measured by clicking on a “share” button, of course). You can measure this by dividing the number of shares by the total number of e-mails delivered and then multiplying the result by 100.
Imagine you had 10 share clicks and 10,000 delivered e-mails. Your forwarding rate would be 0,1%.
(10/10,000)*100=0,1
When you offer a sharing option to your subscribers, you can gauge the type of content that resonates with them enough to want to share it with others. Essentially, this becomes a fresh approach to expanding your subscriber base.
Bounce rate
Bounce rate in e-mail marketing is the percentage of total e-mails sent but were not delivered to your subscribers’ inboxes. There are two types of bounces in the e-mail marketing world:
- soft bounce ─ returns to the sender as undelivered, even though it had initially been accepted by the recipient’s mail server (for example the recipient’s mailbox is full)
- hard bounce ─ returns to the sender as undelivered without ever being accepted by the recipient’s email server (for example e-mail does not exist).
Simply, soft bounces happened due to only temporary reasons, while hard bounces due to permanent reasons.
Either way, a high bounce rate is something any e-mail marketer does not want to see ─ a big portion of their subscriber base did not receive the information they wanted them to see, and their time and resources spent crafting a compelling e-mail campaign were wasted.
It is important to track the bounce rate metric because experiencing an excessive number of hard bounces may potentially lead ISPs (internet service providers) to perceive you as a spammer. On the other hand, if your subscriber base is not receiving your e-mails, you are essentially losing money.
Social Media Metrics
It is important to acknowledge that not all social media platforms will have the same way of calculating their metrics nor will every social media platform have the same set of metrics. That is why it is important to educate yourself about each social media platform and its metric measurement rules.
Awareness social media metrics
Impressions
Impressions indicate the number of times your content or social media profiles were viewed. If a single person saw your content or social media profile twice it is counted as two impressions.
If your number of impressions is much higher than the number of reach that means users are returning to your content multiple times, and this is, of course, a good indicator.
Reach
Reach indicates the number of users that viewed your content or social media profiles. It is important to track this to see how your content is performing since a higher number of non-followers that viewed your content or social media profile can mean users are sharing it or the algorithm picked up on your content.
Audience growth rate
Audience growth rate represents the percentage of new followers in a specific period and is a valuable insight into the rate at which your audience is growing.
You can measure your audience growth rate by dividing the total number of new followers by the total number of followers and then multiplying that result by 100.
(Total Number of New Followers / Total Followers)*100 = Audience Growth Rate
For example, you had 50 new followers in a specific, and your total number of followers is 50,000. This means your Audience Growth Rate for the specific month is 0,1%
Engagement Social Media Metrics
Basic engagement metrics on social media:
- Likes ─ the number of likes on your social media content
- Comments ─ the number of comments on your social media content
- Shares ─ the number of times your content has been shared
- Mentions ─ the number of times someone mentioned your brand on social media
Engagement Rate
The Engagement Rate represents the percentage of engagements on your social media channels. There are multiple ways to measure the Engagement Rate on social media because it depends on how you are approaching the calculation. The most common one is the Engagement Rate per single piece of content:
(Total Number of Engagements Per Post / Reach Per Post)*100 = Engagement Rate
It is best to explore further the different ways to calculate the Engagement Rate on social media to evaluate the best one for your business needs.
Virality Rate
The Virality Rate captures the percentage of how much your content has been shared. This metric takes into account the total number of impressions content gained, and is useful to see how rapidly your content is spreading.
(Total Number of Shares / Total Impressions)*100 = Virality Rate
Amplification Rate
Similar to the Virality Rate, the Amplification Rate captures the percentage of shares per post but takes into account the total number of followers. This metric is interesting to track because you can measure at what rate your followers are sharing your content with others.
(Total Number of Times a Post Has Been Shared / Total Followers)*100 = Amplification Rate
Digital Advertising Metrics
Ad Frequency
Ad Frequency in digital advertising refers to the number of times a specific ad has been viewed by a single user over time.
Digital advertisers track this metric to determine the most convenient amount of times to show an ad. If users are seeing the same ad too frequently, it can be annoying and counterproductive. And if they are not seeing it enough, advertisers might not reach their goals.
Understanding the frequency at which ads are displayed to users enables advertisers to make well-informed choices regarding the allocation of their advertising budgets ─ when to increase or decrease it.
Cost Per Click (CPC)
Cost Per Click (CPC) is a metric that shows how much advertisers are spending per ad click. CPC is a pricing model most commonly used in search engine and social media advertising.
It is a great pricing model for advertisers that want to pay only per clicks their ad generates because it allows them to have better control over their spending, allocating their budget more efficiently.
Cost Per Mille (CPM)
Cost Per Mille (CPM) is a metric that shows how much advertisers are spending per thousand impressions. It is a pricing model most commonly used with display and programmatic advertising.
It is a good choice when your main objective is to increase brand awareness because you are paying by the impressions your ad receives.
Cost Per Acquisition (CPA)
Cost Per Acquisition (CPA) refers to the cost incurred to acquire a desired action or conversion.
Insights into CPA are useful if the advertising objective is to generate immediate responses or conversions (direct response campaigns), as well as when testing different ad creatives.
Return on Ad Spend (ROAS)
Return on Ad Spend (ROAS) is the ROI (return on investment) of digital advertising. ROAS represents the effectiveness of an advertising campaign in generating revenue in relation to the amount of money spent on the campaign.
ROAS can be calculated by dividing the revenue generated from the campaign by the cost of the campaign, and then multiplying it by 100.
Search Engine Optimization (SEO) Metrics
Search engine optimization (SEO) metrics can vary from tool to tool but there are some basic metrics you should definitely know.
Domain Authority
Domain authority (DA) is a ranking metric developed by Moz and it predicts the likelihood of the websites ranking in search engine results pages (SERPs) on a scale from 1 to 100. Moz states that it takes a dozen factors into account, including linking root domains and the total number of links.
It is important to note that it is not a Google ranking factor and does not have any effect on the search engine results pages but is a useful metric to track when evaluating competition or websites strength over time.
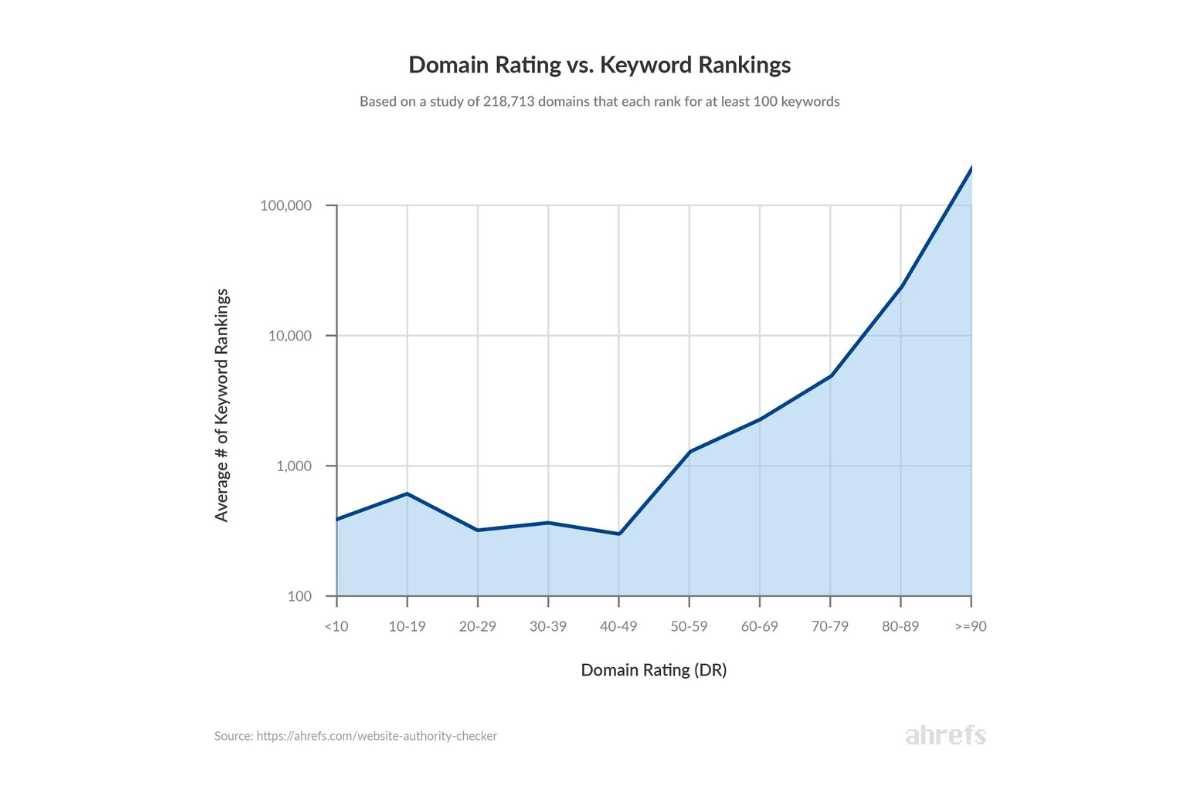
Domain Rating
Domain rating (DR) is a metric developed by Ahrefs and it shows how strong a website’s backlink profile is on a scale of 1 to 100. This metric not only looks at the number of backlinks a domain has but also the quality of those backlinks. SEO specialists and marketers use this metric to evaluate website’s backlink strength and discover off-page SEO opportunities such as link-building.
And a study by Ahrefs discovered a connection between a website’s Domain Rating (DR) and the number of keywords it ranks for.
Keyword Rankings (Positions)
Keyword Position refers to the position (ranking) that a website occupies in search engine results for a particular keyword in comparison to other competing websites.
You want to track this metric to see which of your pages perform the best on search engine results pages for specific keywords, how these positions change over time (monitoring progress), how you stack up against your competitors, and the effectiveness of your overall SEO efforts, both off-site and on-site SEO activities.
No. of Indexed Pages
Indexed Pages refer to the pages that are visible to search engines. You should track the number of your pages indexed on search engines simply because it can help you detect any technical SEO issues with your site. Since indexed pages are the ones that drive traffic, you want to make sure that the pages that you want to be indexed are available to searchers.
On the other hand, there are certain pages that you will want to exclude from search engines so it is another reason why you will want to add this to your list of SEO metrics to track.
Organic Traffic
Organic Traffic is all traffic that you captured to your website organically. It is one of the most important metrics to track since SEO efforts are focused on driving organic traffic.
Organic Conversions
Organic Conversions represent the number of conversions driven by organic traffic. You will need to track this metric if you want to know the return on investment (ROI) of your SEO efforts.
E-commerce Metrics
If you are dealing with an online store, there are some e-commerce metrics you need to know. By tracking the appropriate e-commerce metrics, you will be able to better understand user behavior, make data-driven decisions that can lead to increased ROI, as well as evaluate and make changes to your current marketing efforts.
Average Order Value (AOV)
The Average Order Value metric represents the average amount spent per purchase and is calculated by dividing the total revenue by the total number of orders.
Total Revenue / Total Number of Orders = Average Order Value
By analyzing the Average Order Value you will have the opportunity to evaluate your current pricing strategy and implement tactics that can increase your current AOV like cross-selling or up-selling tactics.
Shopping Cart Abandonment Rate
The Shopping Cart Abandonment Rate metric is the percentage of users who added something to the cart but did not complete the purchase.
1 – (Total Number of Completed orders / Number of Orders Initiated) * 100 = Shopping Cart
The most common factors that lead to high Shopping Cart Abandonment Rates are poor usability and users’ lack of trust in the checkout process, and these are all factors that you can influence.
Customer Lifetime Value (CLV)
The Customer Lifetime Value represents the average customer spending in the period of their entire relationship with an online store.
Average value of a purchase * number of times the customer will buy each year * average length of the customer relationship (in years) = Customer Lifetime Value
The Customer Lifetime Value metric is important for several reasons. By understanding the lifetime value of a customer, you can establish quality retention strategies and personalized campaigns which can increase customer loyalty and satisfaction. You will also have a much better understanding of what customers are most profitable and what customers with the highest CLV buy.
On the other hand, you will want to know more about your customers’ lifetime value simply because it will help you determine the maximum amount you want to spend to maintain profit when acquiring new customers and you will also have a much better understanding of future revenue possibilities.
Customer Acquisition Cost (CAC)
Customer Acquisition Cost metric represents how much you are spending to acquire a customer.
You should track this metric to evaluate the effectiveness of your business activities in acquiring new customers and more importantly, if your business is profitable. If you want to attract potential investors, this metric will be very important.
How to calculate your online stores CAC?
Total Investment in Campaign / Number of New Customers = Customer Acquisition Cost
Understanding digital marketing metrics is only the beginning. To truly unlock their power and achieve remarkable results, you need to go beyond just knowing the numbers. It is all about analyzing, interpreting, and taking action based on the insights they provide.
Need help in advancing your business to the next level? Get in touch with our Performance Marketing Team and let’s unlock the full potential of your digital marketing efforts.